

How did we get to 2023 prices?
We can't predict what the next twelve months will hold, it's pretty futile, but we can show you where we've been over the last sixteen years in Durham Region. The table below (per Toronto Regional Real Estate Board) highlights key peaks and valleys since the 2007 recession which didn't affect Canada until closer to 2008-2009.
Average residential prices in July 2007 were $268,642. We stayed relatively stagnant until March 2010 when prices began to climb to $310,949.
Prices moved upwards more aggressively after that until March 2017 when we hit $698,023. That's more than double the sale prices from 10 years prior.
In October 2016 the Department of Finance implemented a mortgage stress test for insured mortgages which significantly slowed the market within a number of months.
In the first half of 2020, we were all in Covid-19 lockdown and the market stalled with average sale prices at $654,665, but picked up a steady pace starting July 2020 ($709,121) until the peak in February 2022 ($1,229,493).
As of November 2022, largely because of multiple interest rate hikes, the average sale price is $892,667.
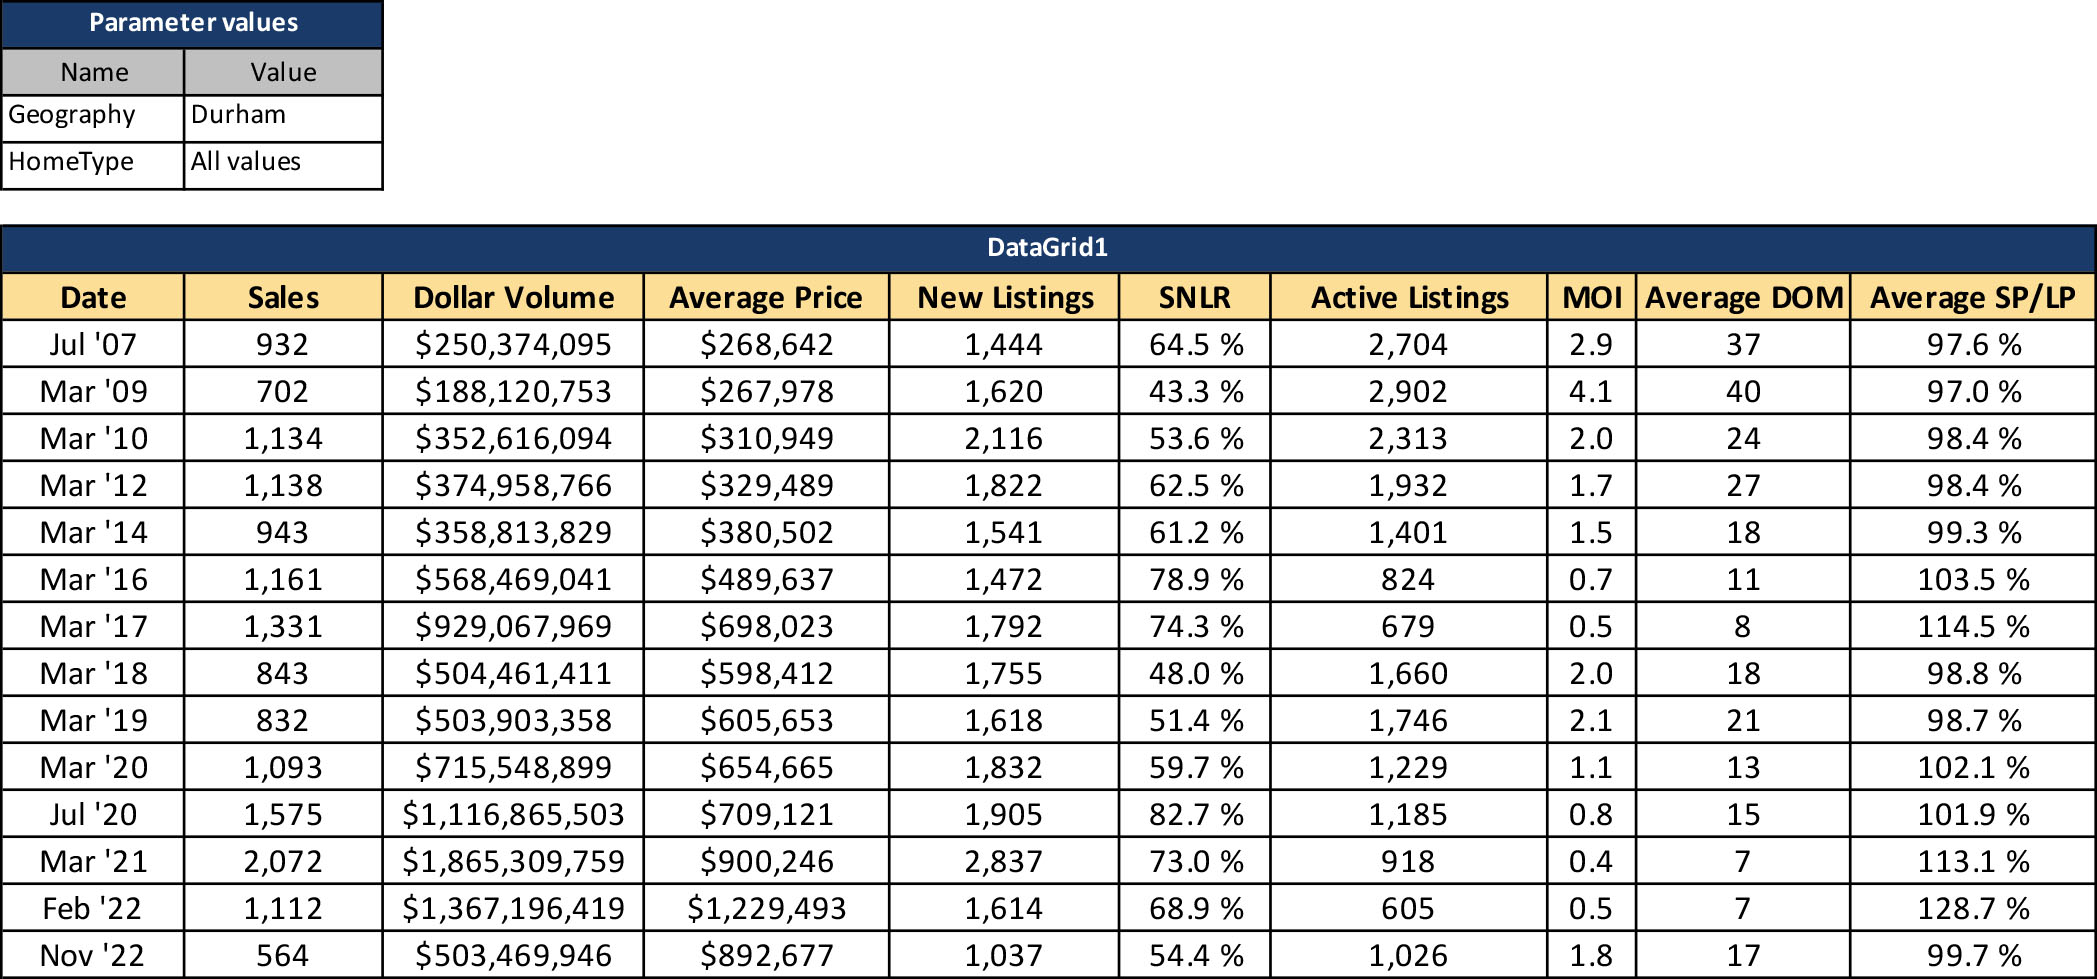
SNLR = Sale to New Listing Ratio (market is balanced and healthy if between 40% - 60%)
MOI = Months of Inventory. DOM = Days on Market. SP/LP = Sale price/list price
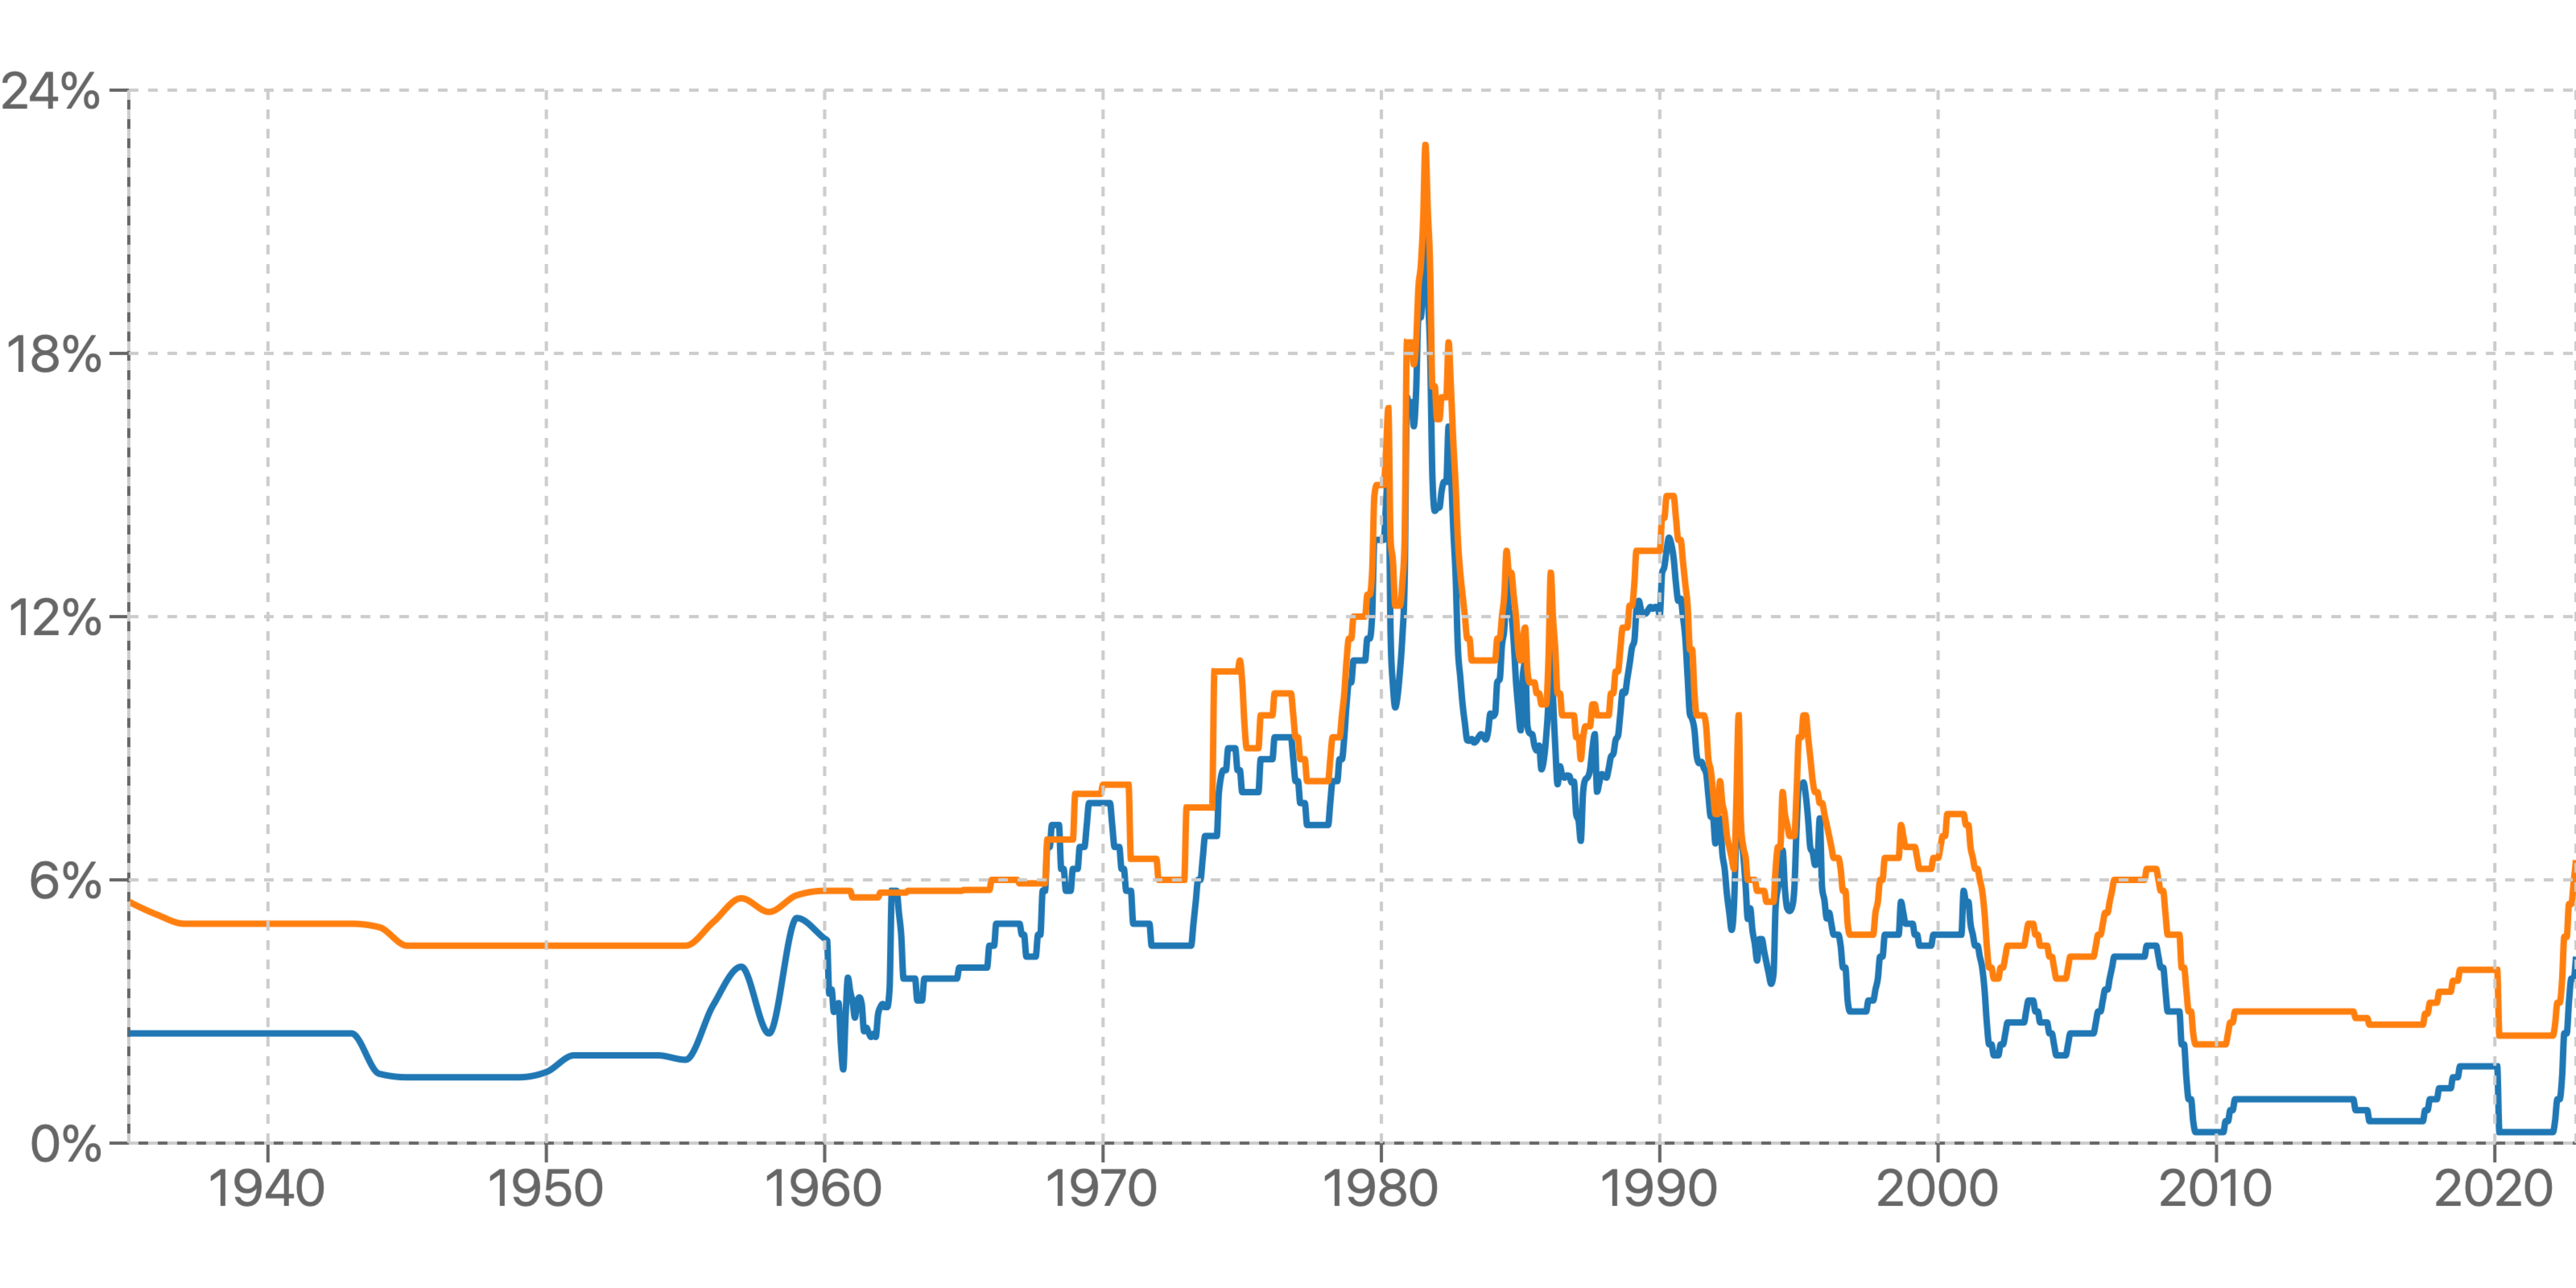
Prime Canada rates table(wowa.ca)
Where do we go from here?
From what we've read, interest rates are close to a new high in the first half of 2023 and may start to go down later in the year once we come out of this inflationary period.
New construction has not dramatically increased, while immigration to Canada (432,000) has.
Interestingly, Ontario is seeing a larger number of residents, already living in Canada, leaving the province with -121,000 net migration. New immigrants to Ontario numbered 227,000 in 2021-2022. We are still growing.
Post a comment